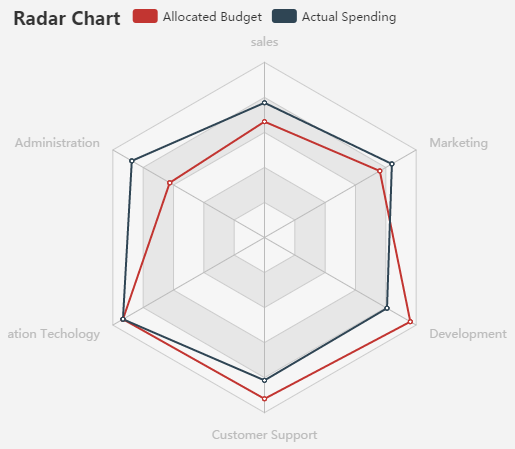
As known as: Spider Chart, Web Chart, Polar Chart, Star Plots.
Radar Charts are a way of comparing multiple quantitative variables. This makes them useful for seeing which variables have similar values or if there are any outliers amongst each variable. Radar Charts are also useful for seeing which variables are scoring high or low within a dataset, making them ideal for displaying performance.
Each variable is provided an axis that starts from the center. All axes are arranged radially, with equal distances between each other, while maintaining the same scale between all axes. Grid lines that connect from axis-to-axis are often used as a guide. Each variable value is plotted along its individual axis and all the variables in a dataset and connected together to form a polygon.