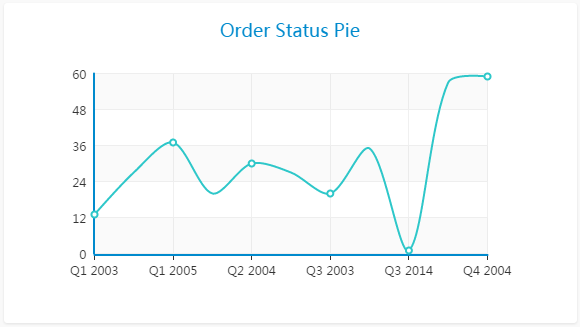
A line chart or line graph is a type of chart which displays information as a series of data points called ‘markers’ connected by straight line segments.
Here is a video that showing you how to build a chart report:
Data format#
Line chart accepts two or more columns. The second through the last column must be numeric.
| Dimension (X Axis) | Measure Y-Axis | ... |
| Label 1 | Row 1 | ... |
| Label 2 | Row 2 | ... |
| Label 3 | Row 3 | ... |
| ... | ... | ... |