Many results are presented in tables that can be pivoted interactively. That is, you can rearrange the rows, columns, and layers.
Pivot reports(Crosstab reports) provide another perspective on the same data you see in the list report.


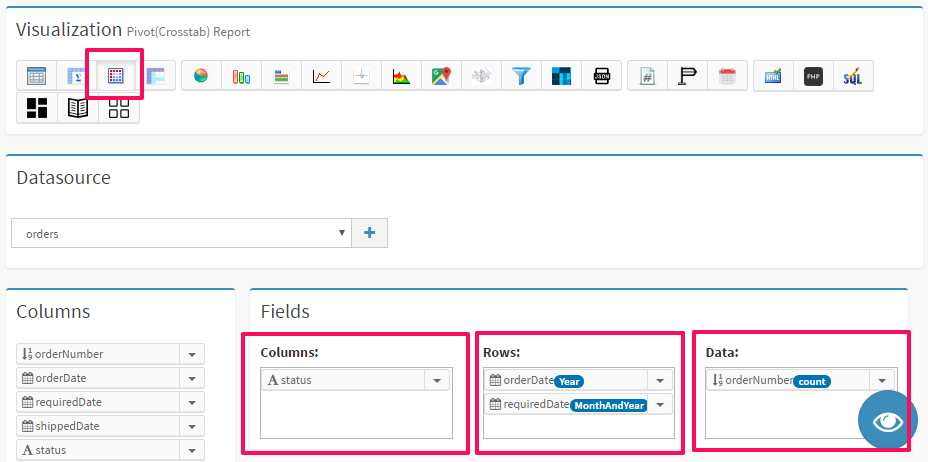
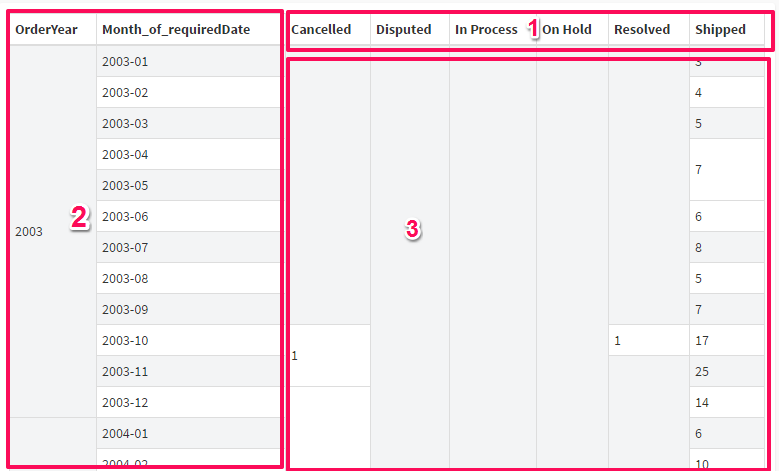
- Columns
- Rows
- Data